Smart publishers recognize the importance of monitoring the performance of their advertising program over time. They know that digging into performance data is the best way to understand trends, spot potential problems, and identify opportunities for improvement.
But evaluating your own program only tells one side of the story. In order to get a complete picture of ad performance, you need to know how your program stacks up against other publishers — both within your vertical and across the wider publishing industry.
Our latest report, Advertising Performance Benchmark Report, offers insights across current, accurate, and reliable benchmark data so you can compare your site(s) to industry averages, understand CPM impact, and adjust their advertising strategy. Using Sovrn Signal, we analyzed more than six months’ worth of CPM data from thousands of independent publishers in the Sovrn Data Collective, covering 136,000 ad units and nearly 2 billion impressions per day.
Top 5 Findings to Help Benchmark Your Ad Performance
Here’s a quick preview of some key takeaways from this report:
1. Ad spend was down in certain categories due to global uncertainty
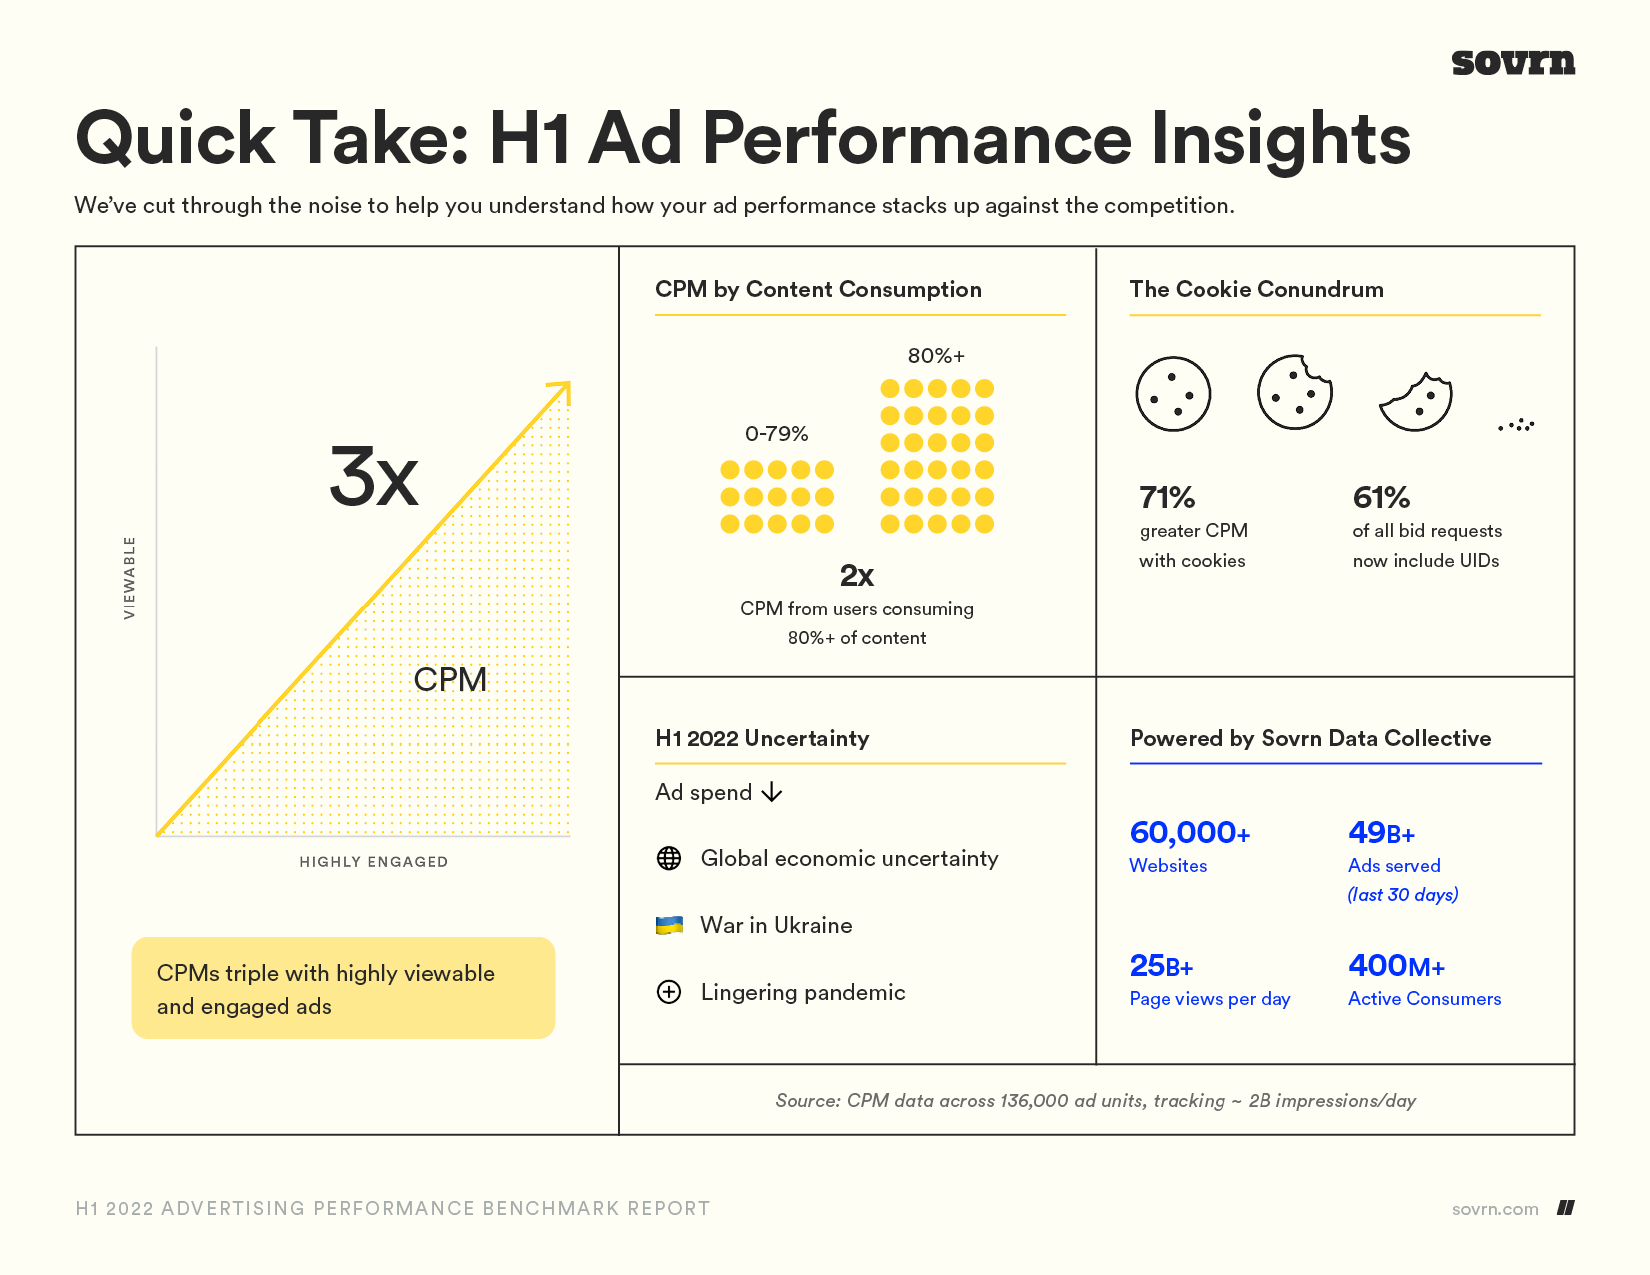
News and business sites saw decreased ad spend in the first half of 2022, as advertisers were wary of appearing alongside negative stories like the war in Ukraine, economic declines, and the ongoing pandemic. Automotive publishers also saw a downward trend in CPMs as supply chain issues continued to plague the industry.
2. Audience attention yields higher CPM
Unless an ad can be seen, it can’t make an impact. Our research found that inventory with 80% viewability or more (meaning there’s at least an 80% likelihood of being seen) drove 3x higher CPMs versus market averages. And after 12 seconds of engagement, CPMs jump by 85%.
3. Site traffic has minimal effect on ad performance
It appears that traffic volume doesn’t matter as much to ad buyers as conventional wisdom might suggest. Our research found that CPMs increase only 9% as sites cross the 10 million monthly page view threshold, as compared to those with less than 10 million page views per month.
4. Scroll depth has a meaningful impact on ad rates
Scroll depth is a metric for evaluating how much of a given page is consumed by the reader. On average, users who view at least 80% of the available content (i.e., scroll depth of 80% or more) are worth twice the CPM of those with a lower scroll depth.
5. Third-party cookies are still the gold standard for ad targeting
The end of third-party cookies is almost inevitable, but they are still the dominant method for granular ad targeting. Our research discovered that CPMs on Chrome (which still uses third-party cookies) are 71% higher than on Safari, where cookies have already been eliminated. And while Universal IDs (UIDs) are being explored as a possible cookie replacement, they currently capture only 10-25% of the value that third-party cookies deliver.
Looking for more?
These are just a few of the many insights, findings, and data points available in our new Advertising Performance Benchmark Report. Download your copy to find out how your site compares to industry averages, understand current performance trends, and identify the factors that can help to improve your overall ad strategy.
If you’re ready to uncover more granular data to evaluate your site performance and drive more revenue, our Signal data tool can help you measure, compare, and monetize your user engagement. Schedule a demo today to learn more!