Over the past week, we’ve talked a lot about engagement and audience attention. We’ve also shared content from our new ebook, Capturing the Signals, to demonstrate how Sovrn Signal can help publishers harness the power of attention to drive more ad revenue.
In this article, we’re going to dig a little deeper into some of Signal’s key features and functionality — specifically the analytics dashboards that help publishers understand their ad performance and the deep insights they offer to Signal users.
Analyze ad performance with Signal Insights
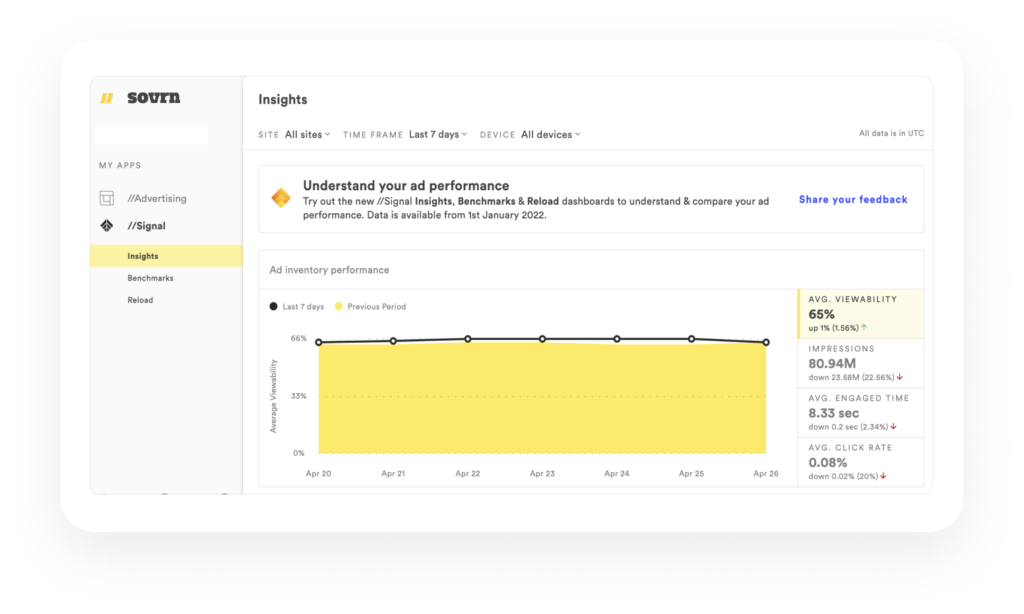
In order to optimize your ad strategy — and maximize the value of your inventory — you need the ability to evaluate ad quality, identify trends, and spot potential problems. The Signal Insights dashboard puts key performance and attention data at your fingertips, so you can make better strategic decisions and drive more revenue.
The Signal Insights dashboard eliminates the need to manually aggregate data from multiple sources. Instead, you can see all the metrics that matter in one simple view:
- Viewability: The percentage of impressions that were viewable, according to the IAB definition.
- Impressions: The number of impressions measured by Signal.
- Engaged time: The average time (in seconds) that users were engaged.
- Click rate: The percentage of impressions that resulted in a user click.
Setting up the Insights dashboard is easy. All you need is one single line of code to capture every impression. And you can segment data as broadly or as narrowly as needed — based on factors like individual domain, time frame, device, or ad unit — to provide the granular performance insights you need.
Compare ad performance against your peers with Signal Benchmarks
If you want a better understanding of how ad buyers value your inventory, you need to see how your ads stack up against the competition. The Signal Benchmarks dashboard lets you compare your own ad performance against groups of similar publishers, or against the market as a whole.
With a single, easy Signal integration, the Benchmarks dashboard gives you benchmark data on key metrics like:
- Viewability: The percentage of impressions that were viewable, according to the IAB definition.
- CPM: The cost per thousand programmatic impressions from Google Ad Manager.
- Engaged time: The average time (in seconds) that users were engaged.
- Click rate: The percentage of impressions that resulted in a user click.
The Benchmarks dashboard lets you compare your performance against thousands of different publisher cohorts. Benchmark data is refreshed daily, and leverages insights from 60,000 global sites. You can even filter data based on factors like individual domain, time frame, ad size, source country and more, to benchmark performance on a more granular level.
Check out the Signal Benchmarks FAQ for more information.
Get started today!
Our Signal technology gives you a simple, scalable way to measure user attention, analyze ad performance, and access deep insights to maximize the value of your ad inventory. It’s easy to get started with Signal, and a single fee gives you access to all its features and dashboards.
To learn more, visit the Signal page on our website or send an email to sales@sovrn.com. Our team would be happy to provide a demo, so you can see the power of Signal for yourself.