
We all know that data is a critical component in analyzing ad performance and optimizing your advertising strategy. But it’s not enough to just have access to the right data. You also need to understand how to use that data to uncover key insights and make better strategic decisions.
Sovrn Signal provides robust analytics capabilities that make it easy to track ad performance and benchmark your ad inventory performance against the market. We shared an overview of the Signal dashboards in a previous blog post, but today we’re going to take a deeper dive into how insights from Signal’s dashboards can help you identify opportunities and take action to drive your business forward.
Signal Insights dashboard
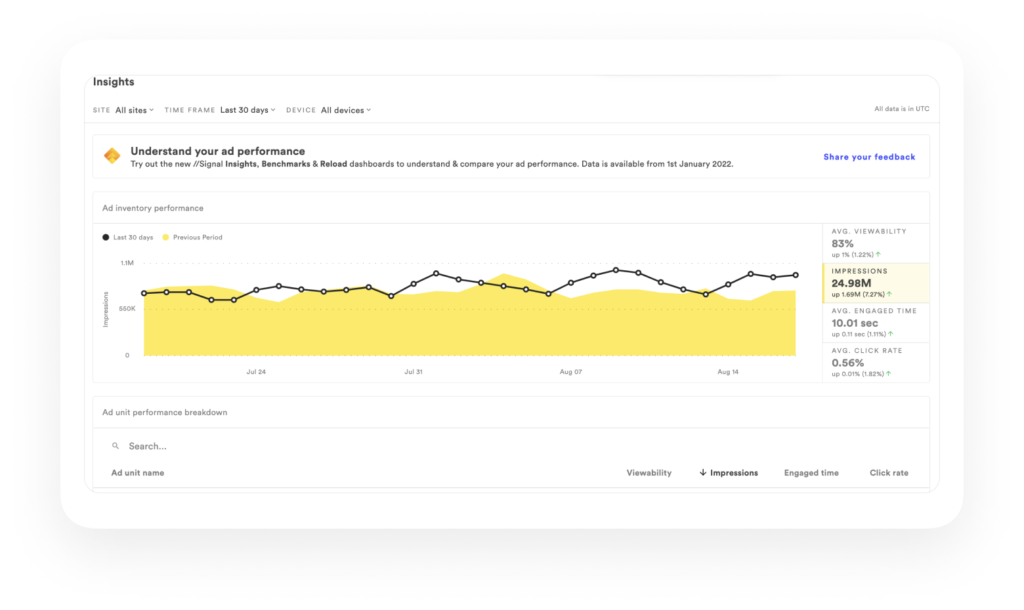
Effective optimization of your ad strategy requires the ability to evaluate ad quality, monitor trends, and recognize potential problems. The Insights dashboard puts key performance and audience attention data at your fingertips, so you can easily analyze your ad inventory performance and see how your ads stack up against industry KPIs.
The Insights dashboard offers all the metrics that matter in one place, including viewability, impressions, engaged time, and click rate. This single, unified view makes it easy to understand your performance without manually aggregating data from multiple sources or building your own graphs.
Here are a couple of ideas for leveraging the Insights dashboard:
Analyze inventory performance over time.
The Insights dashboard makes it easy to spot trends in your ad inventory and identify unexpected drops (or spikes) in performance. As you make changes to optimize your inventory — like adding new demand partners or adjusting ad placements — you can use the Insights dashboard to measure the impact those changes have on overall performance.
Evaluate individual ad performance.
The Insights dashboard includes ad unit-level data, so you can ensure each individual ad is performing as expected. Evaluating discrete ad data makes it easy to identify top performing ads, so you can try to replicate them elsewhere on your site. Ad-level metrics also help to pinpoint ads with poor performance (like low viewability or click rates), so you can make adjustments as needed.
Signal Benchmarks dashboard
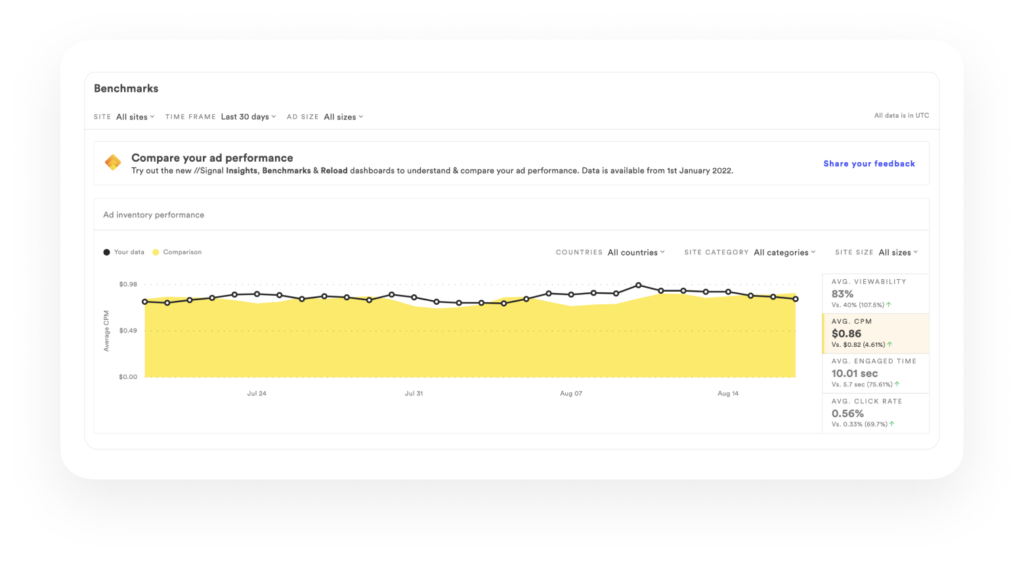
In order to understand the value of your inventory and price it appropriately, you need to know how your ads stack up against the competition. With the Signal Benchmarks dashboard, you can compare your own inventory against your industry peers or against the market as a whole, based on key performance metrics.
Here are a just a few of the many ways you can utilize data from the Benchmarks dashboard:
Improve ad value by comparing CPMs.
Understanding how your ad prices compare to other publishers in your space is the first step toward improving ad value. For example, the Benchmarks dashboard might show that your CPMs are lower than other publishers in your space. By analyzing other data in the Benchmarks dashboard, you might identify low viewability as a possible root cause. From there, you can start A/B testing things like ad placement and sizing to improve your viewability. You could also implement the Signal reload feature to increase viewable impressions. (More on that below.)
Capture higher prices by comparing attention metrics.
Audience attention is one of the main factors advertisers consider in evaluating your ad inventory. If the Benchmarks dashboard shows your viewability and engaged time are higher than your peers, you may be able to demand higher prices for your ad space. Of course, optimizing your price floor can be a challenge — and many publishers worry that pushing their rates too high will cost them bids. Sovrn is currently working on a tool to help automate floor pricing — you can help by completing this brief questionnaire and contacting us if you’re interested in helping us test this new functionality.
Improve CTR by optimizing website experience.
While clicks are a key metric for advertisers, publishers often don’t think much about CTR because they don’t control the ad creative. But there are plenty of ways to improve CTR — and drive more revenue — by improving your on-site experience. For example, if the Benchmarks dashboard shows that CTR is underperforming for certain ads, you could work to upgrade the content that surrounds those ads. You could also adjust ad placement, so ads are located near content with the highest engagement.
The Benchmarks dashboard includes performance data for thousands of different publisher cohorts, and data is refreshed on a daily basis. You can filter data based on country, site category, site size, and more — to generate performance insights on a more granular level.
For even more insights into ad performance across industries — and the factors that impact ad pricing — you can download our Advertising Performance Benchmark Report. This in-depth study analyzes more than six months’ worth of CPM data from thousands of independent publishers to provide accurate, current, and reliable ad performance benchmarks.
Signal Reload dashboard
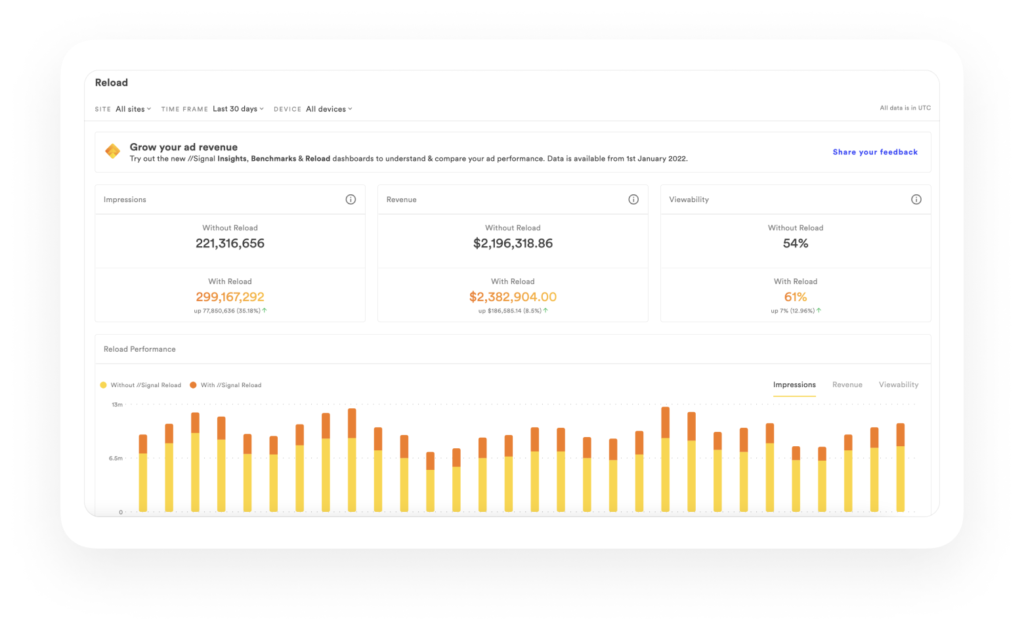
The Signal tool includes a reload feature that refreshes ad inventory after a period (e.g., 20 seconds) of engaged time. This allows publishers to generate incremental revenue by showing additional ads to their most engaged visitors. The Reload dashboard lets you see how much additional revenue you’re earning through reloads and which ad units are providing the most uplift.
Here are some examples of how to use the Reload dashboard:
Validate your reload strategy.
The Reload dashboard provides a snapshot of ad performance both with and without reload, including key metrics like impressions, viewability, and revenue. This lets you see exactly how much uplift you’re getting, so you can confirm that your reload strategy is working as expected. Ad-level metrics also help to identify top ad units so you can replicate their performance.
Troubleshoot reload performance.
The Reload dashboard may show that certain ad units are providing little to no uplift in revenue. With this insight, you can work to identify the cause of this performance lag. For example, you may discover that an ad has poor viewability or the reload feature wasn’t installed on a given page.
Get started with Signal today
All of these insights — and many more — are available with Signal, our easy-to-use data tool that lets you analyze user engagement and convert your engaged audience into ad revenue. With just a single line of code, you can measure user attention on every page and uncover insights to maximize the value of your ad inventory.
To learn more, visit sovrn.com/signal. And when you’re ready to get started, just email us at sales@sovrn.com. Our team will be happy to demonstrate how Signal can work for you and get you started with a free trial.